Somewhere there is a spreadsheet you started in September.
It has a column for every student and a row for every topic, and for about three weeks it was immaculate. Then came a busy week, then half term, and now it is a monument to good intentions with a last-modified date you would rather not look at.
We are not judging. We are saying nobody should have to keep that spreadsheet by hand, because the information is already there. Every practice card a student answers, every live lesson, every Review gets logged as it happens. All Tutorio has to do is show it to you properly.
It does that in three places.
The grid: your whole class in one glance
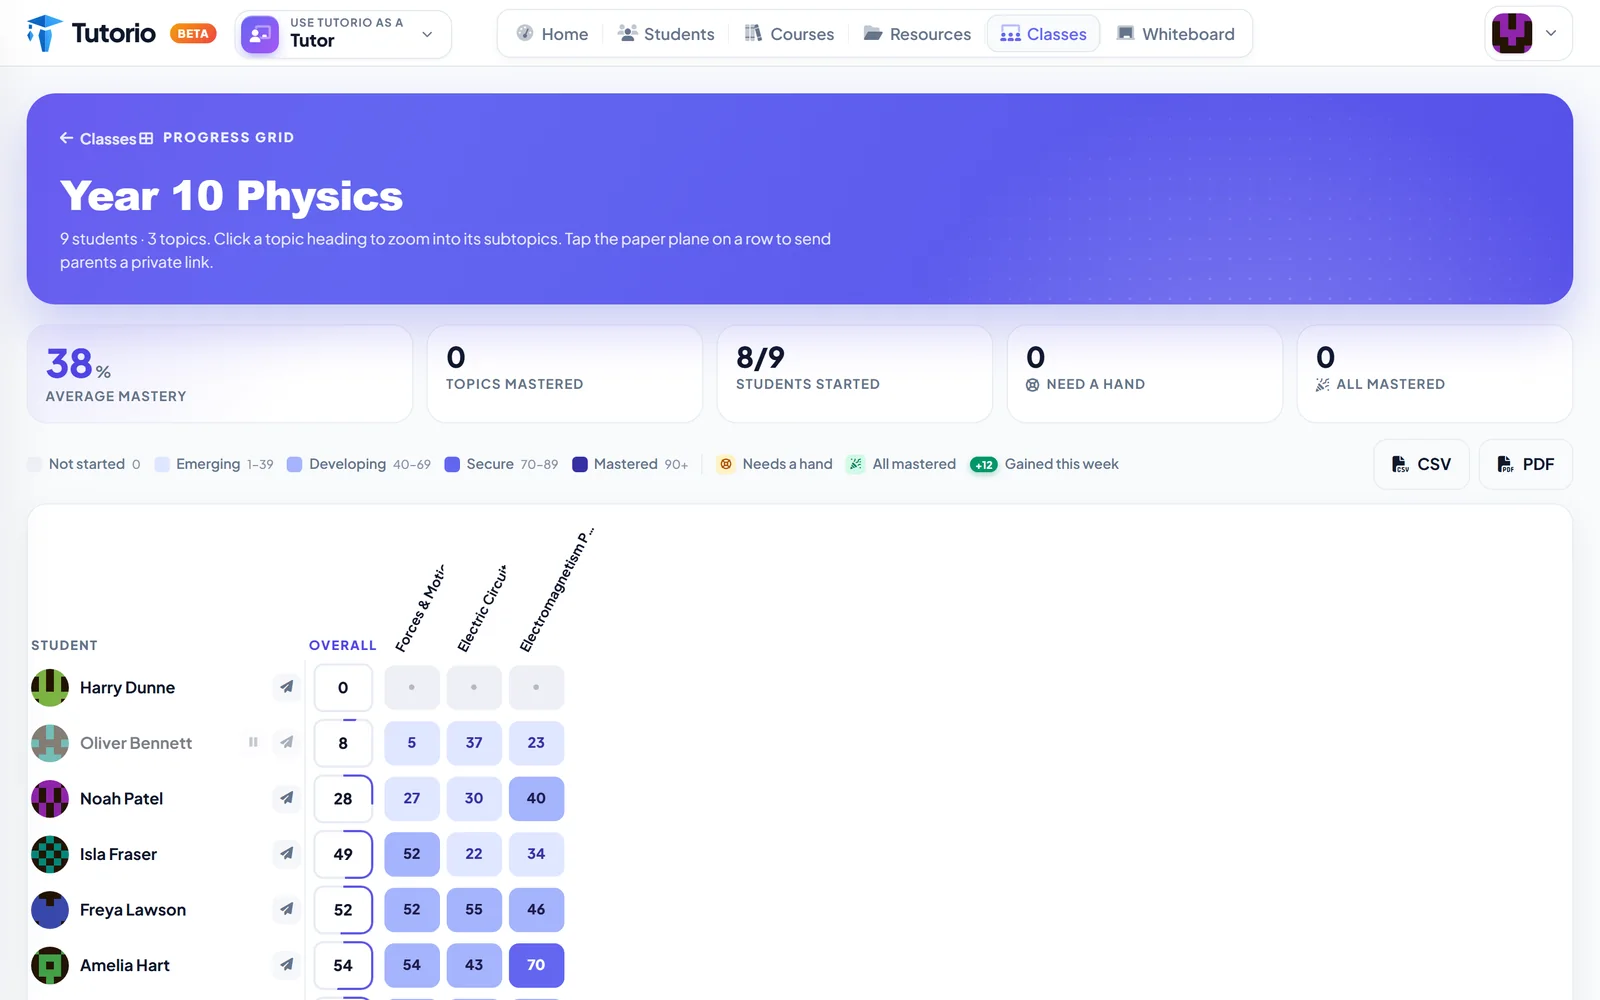
This is the spreadsheet you meant to keep. Read down a column and you see how a topic landed with the whole group. Read along a row and you see one student across everything.
The shading uses four bands, with the key printed right above the grid:
Here is how to read it in ten seconds. A pale column means the topic needs teaching again, because it did not land with anyone. A pale row means a student needs a conversation. Those are different problems, and the grid lets you tell them apart at a glance.
Want to know which idea inside a topic is the culprit? Click the topic heading and it opens out into subtopics. The grid also flags anyone who needs a hand, and shows a little green number for what each student gained this week.
The CSV and PDF buttons export the whole grid. Useful for a school report, a parents' evening, or just proving to yourself that term went better than it felt.
Insights: the questions you would otherwise work out by hand
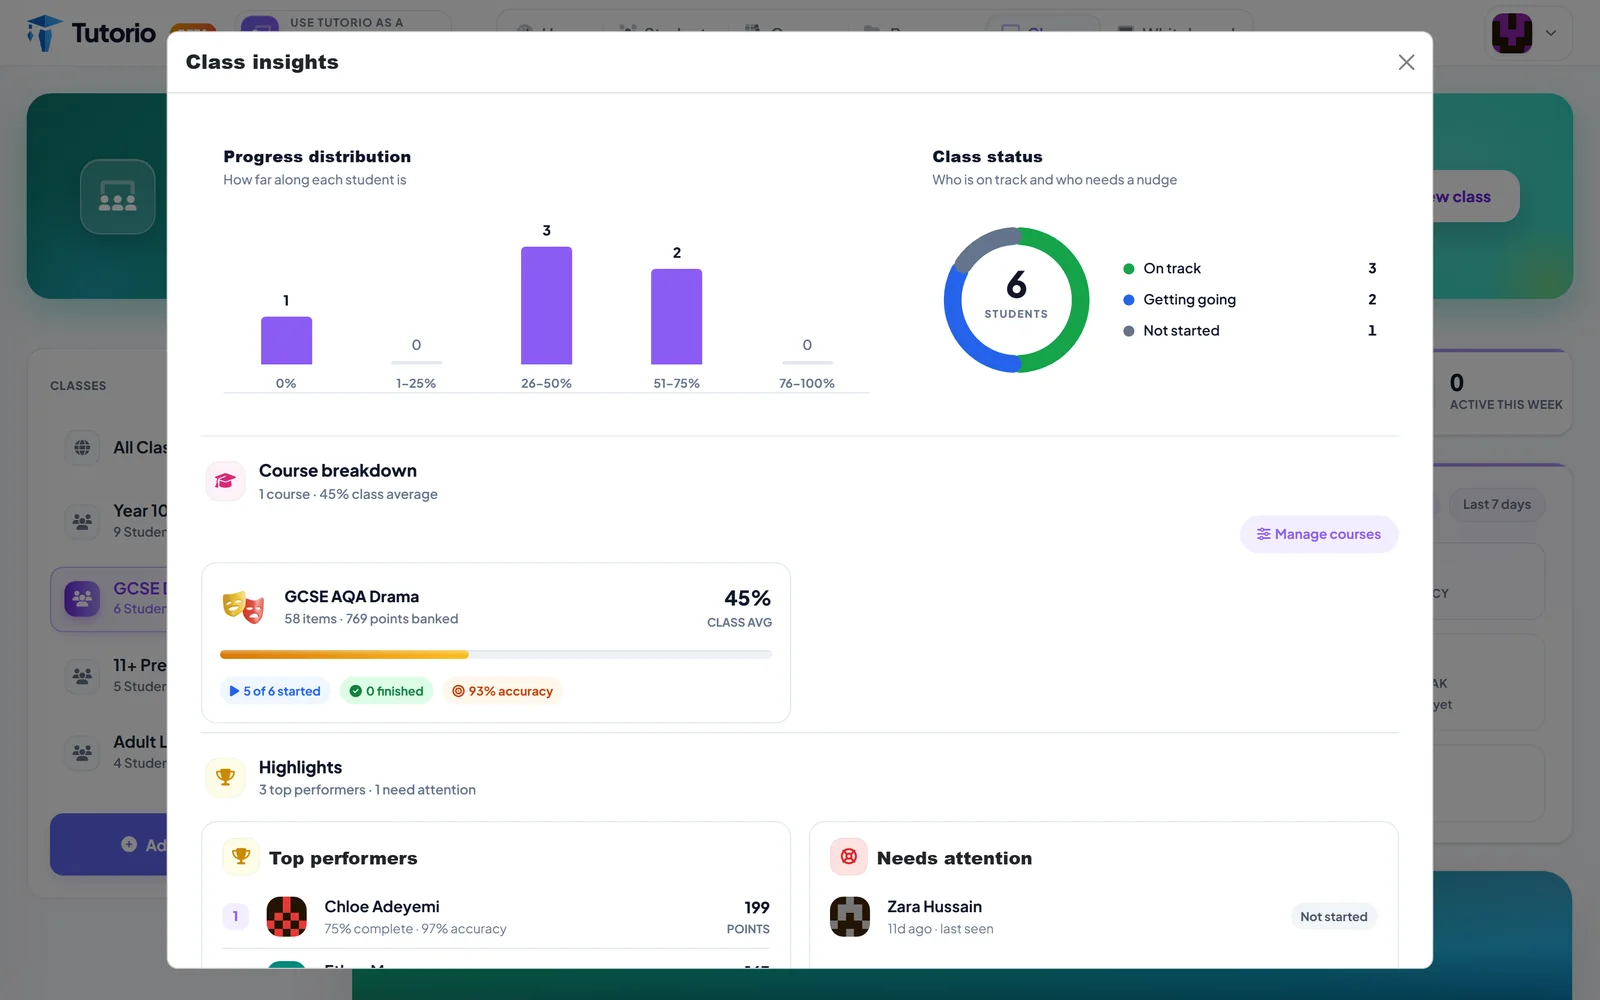
Press Insights on any class. It tells you how far along each student is, and sorts the class into three honest groups: on track, getting going, and not started.
Below that are two short lists. Top performers is who to stretch. Needs attention is who to message tonight.
They are short on purpose. A list of fifteen students who need attention is not a list, it is a guilt trip. One name is something you can act on before bed.
The profile: one student, properly
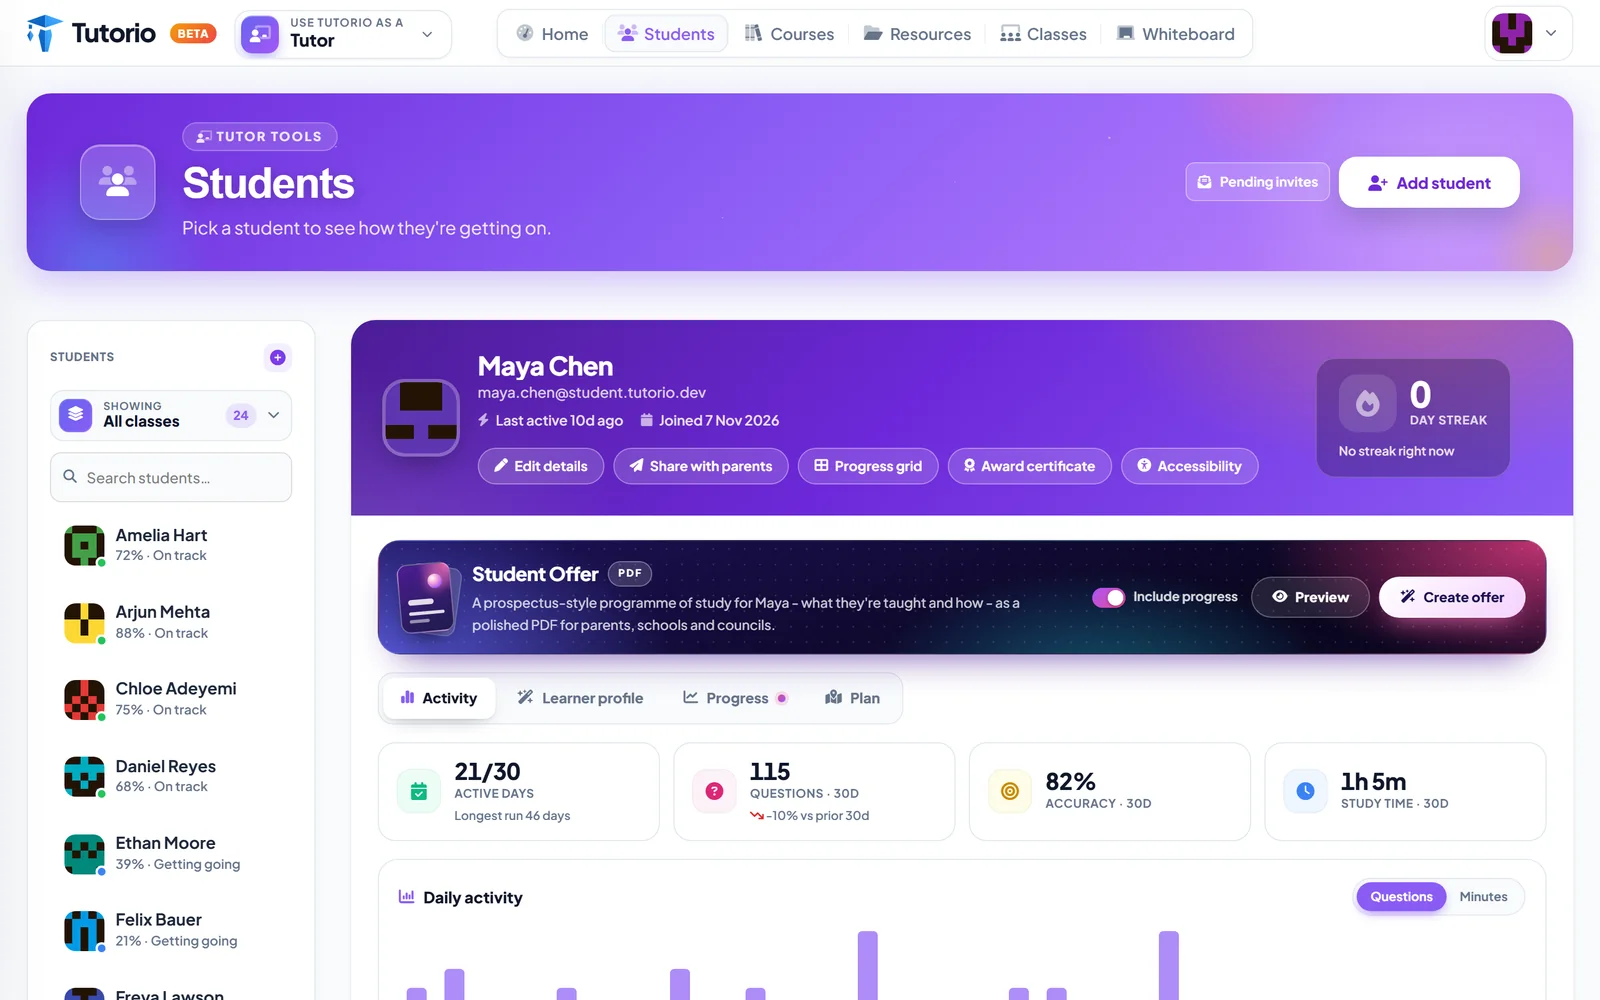
Click any student and you get their page. The first number on it is our favourite: active days. Maya has shown up on 21 of the last 30.
That one figure tells you more about her term than any single test score. A student who turns up most days and gets 82% is in a completely different place from one who crammed on Sunday night and got the same.
Then open the Progress tab.
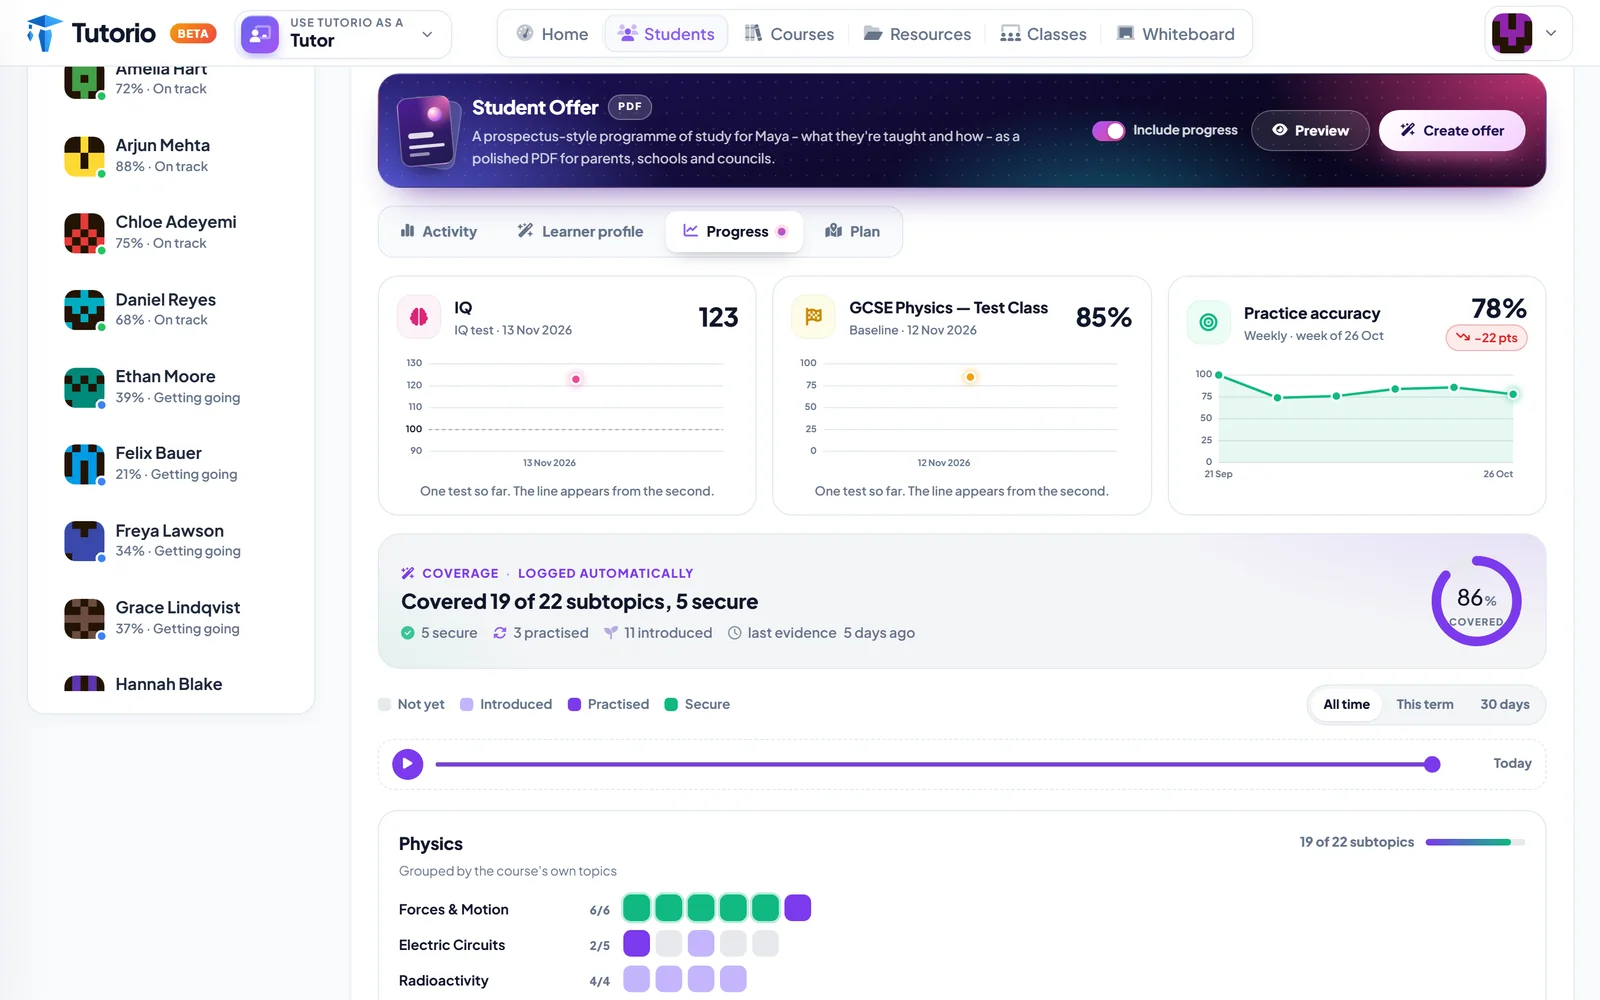
Test results over time. Practice accuracy week by week. And a line that reads Covered 19 of 22 subtopics, 5 secure, with every subtopic marked as not yet, introduced, practised or secure.
Nobody typed that in. It is simply what happened, written down as it happened. There is even a play button that replays the term, so you can watch the coloured squares fill in from September onwards. Slightly indulgent. Surprisingly moving at a parents' evening.
Speaking of parents
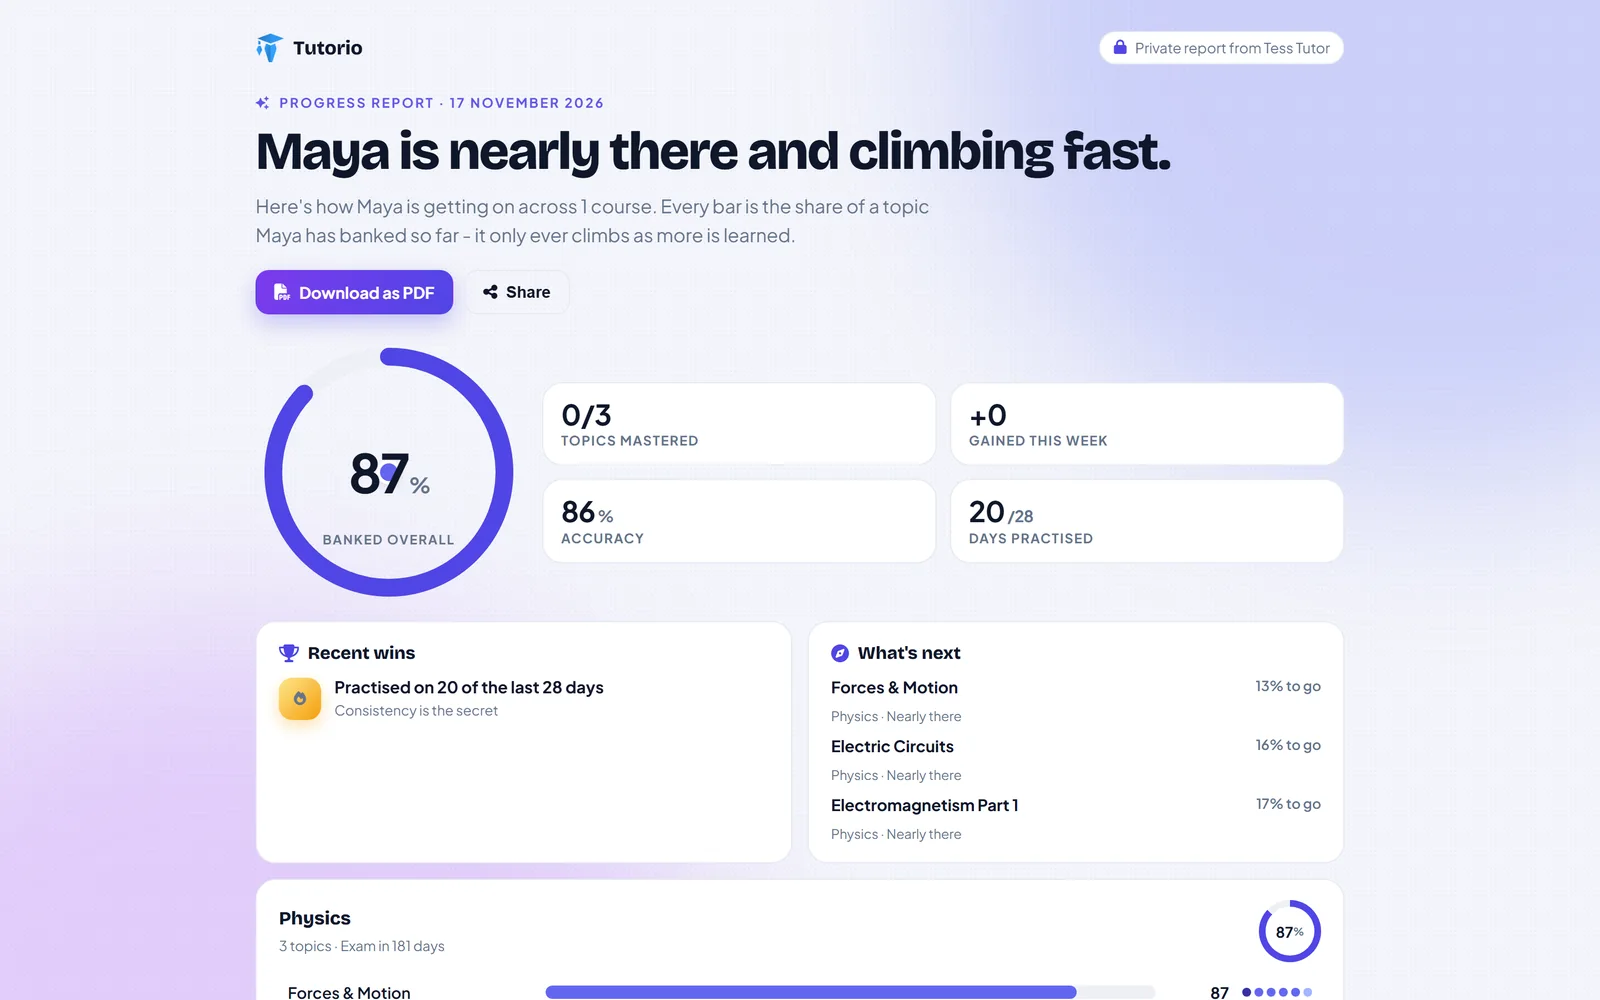
They want to know the same things you do, and now you can show them. The paper plane next to each student on the grid sends a private link to that student's progress, no account needed. What they see on the other end is a post in itself: what parents see when you press the paper plane.
The point of all this
Nothing on these three screens asked you to do any admin. They are a side effect of teaching. Deliver a lesson, set some practice, run a Review, and the picture colours itself in.
Which gives you back the thing the spreadsheet was eating: the time to look at the picture and decide what to do about it.
Questions people ask
How do I track student progress without a spreadsheet?
You do not enter anything. Every practice card, live lesson and Review is logged as it happens, and the progress grid shows it as one row per student and one column per topic.
What do the mastery bands mean?
There are four: Emerging (1 to 39), Developing (40 to 69), Secure (70 to 89) and Mastered (90 and above). The darker the square, the more secure the student is on that topic.
Can I export the progress grid?
Yes. The CSV and PDF buttons export the whole grid, which is useful for a school report or a parents' evening.
Can parents see their child's progress?
Yes. The paper plane beside each student sends a private link to that student's progress, with no account needed. Here is what parents see.

Written by the Tutorio team. We build Tutorio, so these posts describe the product as it is today. Every screenshot is a real capture of the app, and anything that changes gets an updated date. Spotted something out of date? Tell us.